1)エアフロー改善によりその効果を日常的に把握したい。
2)自作2号機のハードウェア監視をしたい。
きっかけは、このwikiでも掲載しましたが、エアーフローの改善を行いました。
しかしながら、CPU温度、HDD温度、ファン回転数などを日々モニタリング出来ると良いなぁ。と、言ったのが事の始まりです。
もう少し詳しく要件を書きます。
1)エアフロー改善によりその効果を日常的に把握したい。
(1)CPU温度とHDD温度を時間単位で知りたい。
(2)マザーボードの温度を時間単位でグラフ化したい。
(3)ファンの回転数を時間単位でグラフ化したい。
2)自作2号機のハードウェア監視をしたい。
(1)HDDの使用状況をスライス別にグラフ化したい。
(2)メモリの利用状況をグラフ化したい。
(3)ネットワークの送受信パケットをグラフ化したい。
出来れば簡単な仕組みで構築に時間をかけずに「サクッ」と出来れば尚良いなぁ。
そんで、上記を定期的に更新出来る仕組みが欲しいですね。
では、順番に見ていきましょう。
1)エアフロー改善によりその効果を日常的に把握したい。
(1)CPU温度とHDD温度を時間単位で知りたい。
(2)マザーボードの温度を時間単位でグラフ化したい。
(3)ファンの回転数を時間単位でグラフ化したい。
1.mbmonのインストール
まずは、どうやって検出するかがポイントになりますね。
一番簡単に実現出来る手段としては、mbmonによる検出だと思いますので、mbmonをインストールして実験してみましょう。
mbmonは、/usr/ports/sysutils/mbmon にあります。make install し、以下を実行します。
Dreamcraft2 # /usr/local/bin/mbmon -T 7 -i -u -n -c 1
42
37
6:48am  up 1 day,  7:09
こんな感じで測定できます。mbmonの詳しいオプション情報はヘルプをご覧ください。
←mbmonのヘルプが見れます。
2.snmpdのインストール
さて、これでCPUの温度を検出出来ることが分かりました。
次はメモリ利用量やHDD利用量の検出です。これらの値を検出する方法もいろいあるのですが、僕は後々の事を考えてSNMPを使いました。
まずは、snmpdをインストールします。/usr/ports/
インストール後は、/usr/local/share/snmp/snmpd.confを編集します。僕は以下のようにしました。
#com2sec	notConfigUser	default	public
#group		notConfigGroup			v1				notConfigUser
#group		notConfigGroup			v2c			notConfigUser
#view			systemview					included	.1.3.6.1.2.1.1
#view			systemview					included	.1.3.6.1.2.1.25.1.1
#access		notConfigGroup			""	any		noauth	exact	systemview		none none

com2sec		local				localhost		private
com2sec		localnetwork	192.168.11.4	public

group		MyROGroup	v1			local
group		MyROGroup	v2c		local
group		MyROGroup	usm		local
group		MyROGroup	v1			localnetwork
group		MyROGroup	v2c		localnetwork
group		MyROGroup	usm		localnetwork

view		all		included	.1		80

access		MyROGroup	""		any	noauth		exact  all    none   none
syslocation 	Home Server
syscontact	root
proc		mountd

disk /			10000
disk /home		10000
disk /home2	10000
disk /home3	10000
disk	/home4	10000

disk /			10%
disk /var		10%
disk /tmp		10%
disk /home		10%
disk /home2	10%
disk /home3	10%
disk /home4	10%
snmpdの起動は、/etc/rc.confに以下を記述しました。
snmpd_enable="YES"
snmpd_flags="-a"
snmpd_conffile="/usr/local/share/snmp/snmpd.conf"
snmptrapd_enable="YES"
snmptrapd_flags="-a -p /var/run/snmptrapd.pid"
3.mrtgのインストール
いよいよmrtgのインストールです。/usr/ports/net-mgmt/mrtg よりインストールします。
インストール後は、mrtg.cfgを編集します。
僕のmrtg.cfgは以下のようにしました。未だ一部修正が必要なところがあります。
######################################################################
# System: Dreamcraft2.workgroup
# Description: FreeBSD Dreamcraft2.workgroup 8.2-RELEASE
# Contact: root
# Location: Home Server
######################################################################
WorkDir: /usr/local/www/apache22/data/mrtg
Options[_]: growright, noinfo
EnableIPv6:no
Refresh:300
Language:eucjp
Target[192.168.11.4_sk0]: \sk0:public@192.168.11.4:
SetEnv[192.168.11.4_sk0]: MRTG_INT_IP="192.168.11.4" MRTG_INT_DESCR="sk0"
MaxBytes[192.168.11.4_sk0]: 12500000
Title[192.168.11.4_sk0]: sk0 -- Dreamcraft2.workgroup
PageTop[192.168.11.4_sk0]: <H1>sk0 -- Dreamcraft2.workgroup</H1>
Target[sk0]: \sk0:public@192.168.11.4:
SetEnv[sk0]: MRTG_INT_IP="192.168.11.4" MRTG_INT_DESCR="sk0"
MaxBytes[sk0]: 12500000
Title[sk0]: sk0 -- Dreamcraft2.workgroup
PageTop[sk0]: <H1>sk0 -- Dreamcraft2.workgroup</H1>
#<div id="sysdetails">
# <table>
# <tr><td>System:</td> <td>Dreamcraft2.workgroup in Home Server</td></tr>
# <tr><td>Maintainer:</td> <td>Dreamcraft2 <Dreamcraft2.workgroup></td></tr>
# <tr><td>Description:</td><td>sk0 </td></tr>
# <tr><td>ifType:</td> <td>ethernetCsmacd (6)</td></tr>
# <tr><td>ifName:</td> <td></td></tr>
# <tr><td>Max Speed:</td> <td>100 MBytes/s</td></tr>
# <tr><td>Ip:</td> <td>192.168.11.4 (Dreamcraft2.workgroup)</td></tr>
# </table>
#</div>
### CPU Load Average ###
Target[cpu]: .1.3.6.1.4.1.2021.10.1.5.1&.1.3.6.1.4.1.2021.10.1.5.2:public@192.168.11.4
MaxBytes[cpu]: 100
Unscaled[cpu]: dwmy
Options[cpu]: gauge, absolute, growright, noinfo, nopercent
YLegend[cpu]: CPU Load(%)
ShortLegend[cpu]: (%)
LegendI[cpu]: 1分間平均
LegendO[cpu]: 5分間平均
Legend1[cpu]: 1分間平均(%)
Legend2[cpu]: 5分間平均(%)
Title[cpu]: CPU使用率
PageTop[cpu]: <H1>CPU</H1>
### Memory Free ####
Target[mem]: .1.3.6.1.4.1.2021.4.6.0&.1.3.6.1.4.1.2021.4.4.0:public@192.168.11.4
MaxBytes1[mem]: 385724
MaxBytes2[mem]: 2097144
Unscaled[mem]: dwmy
Options[mem]: gauge, absolute, growright, noinfo
YLegend[mem]: Mem Free(Bytes)
ShortLegend[mem]: Bytes
kilo[mem]: 1024
kMG[mem]: k,M,G,T,P
LegendI[mem]: Real
LegendO[mem]: Swap
Legend1[mem]: 空き物理メモリ[MBytes]
Legend2[mem]: 空きスワップメモリ[MBytes]
Title[mem]:
PageTop[mem]: <H1>Memory used</H1>
### Disk Used ####
Target[disk]: .1.3.6.1.4.1.2021.9.1.9.1&.1.3.6.1.4.1.2021.9.1.9.1:public@192.168.11.4
MaxBytes[disk]: 100
Unscaled[disk]: dwmy
Options[disk]: gauge, absolute, growright, nopercent, noinfo
YLegend[disk]: Disk Used(%)
ShortLegend[disk]: (%)
LegendI[disk]: / Disk used
LegendO[disk]: / Disk used
Legend1[disk]: / Disk used
Legend2[disk]: / Disk used
Title[disk]: ディスク使用率
PageTop[disk]: <H1>HDD used</H1>
### /home Disk Used ####
Target[home]: .1.3.6.1.4.1.2021.9.1.9.2&.1.3.6.1.4.1.2021.9.1.9.2:public@192.168.11.4
MaxBytes[home]: 100
Unscaled[home]: dwmy
Options[home]: gauge, absolute, growright, nopercent, noinfo
YLegend[home]: Disk Used(%)
ShortLegend[home]: (%)
LegendI[home]: /home Disk used
LegendO[home]: /home Disk used
Legend1[home]: /home Disk used
Legend2[home]: /home Disk used
Title[home]: /home ディスク使用率
PageTop[home]: <H1>HDD used of /home </H1>
### /home2 Disk Used ####
Target[home2]: .1.3.6.1.4.1.2021.9.1.9.3&.1.3.6.1.4.1.2021.9.1.9.3:public@192.168.11.4
MaxBytes[home2]: 100
Unscaled[home2]: dwmy
Options[home2]: gauge, absolute, growright, nopercent, noinfo
YLegend[home2]: Disk Used(%)
ShortLegend[home2]: (%)
LegendI[home2]: /home2 Disk used
LegendO[home2]: /home2 Disk used
Legend1[home2]: /home2 Disk used
Legend2[home2]: /home2 Disk used
Title[home2]: /home2 ディスク使用率
PageTop[home2]: <H1>HDD used of /home2 </H1>
### /home3 Disk Used ####
Target[home3]: .1.3.6.1.4.1.2021.9.1.9.4&.1.3.6.1.4.1.2021.9.1.9.4:public@192.168.11.4
MaxBytes[home3]: 100
Unscaled[home3]: dwmy
Options[home3]: gauge, absolute, growright, nopercent, noinfo
YLegend[home3]: Disk Used(%)
ShortLegend[home3]: (%)
LegendI[home3]: /home3 Disk used
LegendO[home3]: /home3 Disk used
Legend1[home3]: /home3 Disk used
Legend2[home3]: /home3 Disk used
Title[home3]: /home3 ディスク使用率
PageTop[home3]: <H1>HDD used of /home3 </H1>
### /home4 Disk Used ####
Target[home4]: .1.3.6.1.4.1.2021.9.1.9.5&.1.3.6.1.4.1.2021.9.1.9.5:public@192.168.11.4
MaxBytes[home4]: 100
Unscaled[home4]: dwmy
Options[home4]: gauge, absolute, growright, nopercent, noinfo
YLegend[home4]: Disk Used(%)
ShortLegend[home4]: (%)
LegendI[home4]: /home4 Disk used
LegendO[home4]: /home4 Disk used
Legend1[home4]: /home4 Disk used
Legend2[home4]: /home4 Disk used
Title[home4]: /home4 ディスク使用率
PageTop[home4]: <H1>HDD used of /home4 </H1>
Target[cputemp]: `/usr/local/bin/mbmon -T 7 -i -u -n -c 1`
MaxBytes[cputemp]: 80
Title[cputemp]: CPU temperature -- Dreamcraft2.workgroup in FreeBSD
PageTop[cputemp]: <H1>CPU temperature -- Dreamcraft2.workgroup</H1>
<TABLE>
<TR><TD>System:</TD> <TD>Dreamcraft2.workgroup in FreeBSD</TD></TR>
<TR><TD>Maintainer:</TD> <TD>root</TD></TR>
<TR><TD>CPU:</TD><TD>Core2 Quad Q9650 3.00GHz</TD></TR>
<TR><TD>Chipset:</TD><TD></TD></TR>
<TR><TD>Mother Board:</TD><TD>ASUS P5Q-E</TD></TR>
<TR><TD>Monitor Chip:</TD><TD></TD></TR>
</TABLE>
Options[cputemp]: nopercent, gauge, absolute, withzeroes, noinfo, growright
YLegend[cputemp]: centigrade
ShortLegend[cputemp]: [℃]
Legend1[cputemp]: CPU 温度
Legend2[cputemp]: MB 温度
LegendI[cputemp]: CPU:
LegendO[cputemp]: MB:
Target[fan]: `/usr/local/bin/mbmon -F 4 -u -n -c 1`
MaxBytes[fan]: 5000
Title[fan]: FAN Speed -- Dreamcraft2.workgroup in FreeBSD
PageTop[fan]: <H1>FAN Speed -- Dreamcraft2.workgroup in FreeBSD</H1>
<TABLE>
<TR><TD>System:</TD> <TD>Dreamcraft2.workgroup in FreeBSD</TD></TR>
<TR><TD>Maintainer:</TD> <TD>root</TD></TR>
<TR><TD>CPU:</TD><TD>Core2 Quad Q9650</TD></TR>
<TR><TD>Chipset:</TD><TD>Intel</TD></TR>
<TR><TD>Mother Board:</TD><TD>ASUS P5Q-E</TD></TR>
</TABLE>
Options[fan]: nopercent, gauge, absolute, withzeroes, noinfo, growright
YLegend[fan]: rpm
ShortLegend[fan]: [rpm]
Legend1[fan]: CPU FAN 回転数
Legend2[fan]: 電源 FAN 回転数
LegendI[fan]: CPU:
LegendO[fan]: Power:
Target[hdd_temp]: `smartctl -a /dev/ad10 | grep Temp | awk '{if($1 == "194") print $10;print $10;}'`
MaxBytes[hdd_temp]: 100
Title[hdd_temp]: HDD温度
PageTop[hdd_temp]: <h1>HDD温度</h1>
Options[hdd_temp]: noinfo, integer,nopercent, gauge, absolute, unknaszero
Factor[hdd_temp]: 1
YTicsFactor[hdd_temp]: 1
YLegend[hdd_temp]: Temperature
ShortLegend[hdd_temp]: degrees
Legend1[hdd_temp]: /dev/ad10 Temperature
Legend2[hdd_temp]: /dev/ad10 Temperature
LegendI[hdd_temp]: /dev/ad10 Temp.
LegendO[hdd_temp]: /dev/ad10 Temp.
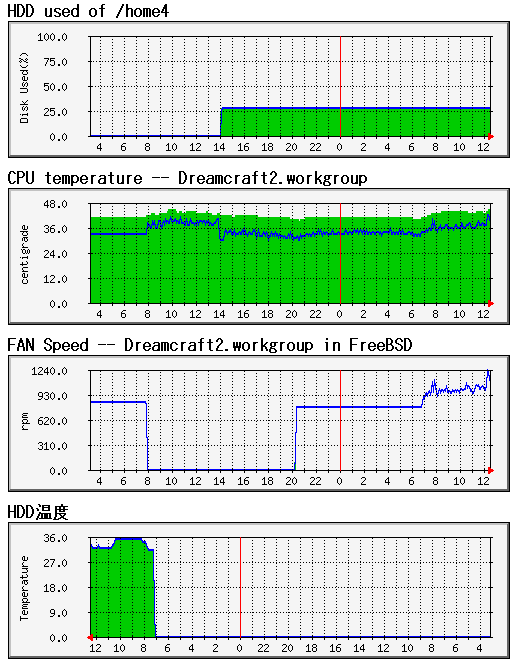
これで、ネットワークの送受信パケット状況、CPU負荷、メモリ利用量、HDD利用量、CPU温度、ファン回転数、HDD温度を検出しグラフ化しました。
これらのデータを保存する場所として、/usr/local/www/apache22/data/mrtg にしました。
後は、snmpdを実行してインデックスファイルを以下のようにして作成します。
env LANG=C /usr/local/bin/mrtg /usr/local/etc/mrtg/mrtg.cfg
indexmaker --columns=1 --addhead='<META HTTP-EQUIV="Content-Type" CONTENT="text/html; charset=UTF-8">' /usr/local/etc/mrtg/mrtg.cfg > /usr/local/www/apache22/data/mrtg/index.html
これで完了です。以下のように表示されれば完了です。