チュートリアル:Cluster Maker 
スライドショー Cluster_Maker (約12分)
ハンドアウト Cluster_Maker_Handout.pdf (7ページ)
チュートリアルのソース (訳注:リンクなし)
チュートリアルのキュレーター Anna Kuchinsky, Scooter Morris
clusterMakerはCytoscapeプラグインであり、様々なクラスタリング手法をまとめ一つのインターフェースで表示するものです。現在のクラスタリングアルゴリズムは、発現や遺伝子データのクラスタリングについてのHierarchicalやk-Means法であり、また、MCLやFORCEはタンパク質ファミリーを探す類似ネットワーククラスタリング手法として準備されています。
生物学的ユースケース: あり得る複合体、タンパク質ファミリー、機能上の関連、生物学的な意味の見地を見つけていきます。
前提条件: グループの特徴を見ていくために、MetaNodePlugin2 と NamedSelection プラグインをインストールしてください。
ハンドアウト Cluster_Maker_Handout.pdf (7ページ)
チュートリアルのソース (訳注:リンクなし)
チュートリアルのキュレーター Anna Kuchinsky, Scooter Morris
Contents
1 手順
1.1 興味あるサブネットを決定するためにクラスタリングを実行しましょう
1.2 Visualize and navigate the clusters
1.3 Animate expression values over time 2 Finding modules and complexes 2.1 Procedure 2.2 Add a new edge attribute 2.3 Create Clusters 2.4 Visualizing Clusters
clusterMakerはCytoscapeプラグインであり、様々なクラスタリング手法をまとめ一つのインターフェースで表示するものです。現在のクラスタリングアルゴリズムは、発現や遺伝子データのクラスタリングについてのHierarchicalやk-Means法であり、また、MCLやFORCEはタンパク質ファミリーを探す類似ネットワーククラスタリング手法として準備されています。
生物学的ユースケース: あり得る複合体、タンパク質ファミリー、機能上の関連、生物学的な意味の見地を見つけていきます。
前提条件: グループの特徴を見ていくために、MetaNodePlugin2 と NamedSelection プラグインをインストールしてください。
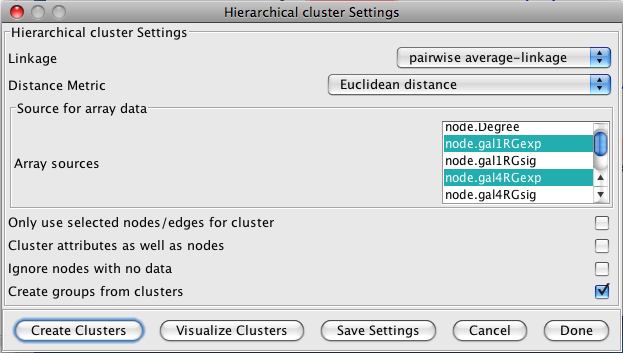
- Plugins → Cluster → Hierarchical clusterを選択します。
- In the Source for array data box, select node.gal1RGexp, node.gal4RGexp, and node.gal80Rexp. 訳注:Source for array data boxが表示されず停止
- Deselect Only use selected nodes/edges for cluster.
- Click Create Clusters.
- When you have created the clusters, the Visualize Clusters clusters button should become active. Click Visualize Clusters.
You will now see an Eisen treeview visualization. On the treeview window, explore by clicking on points on the dendogram. Clicking/selecting a particular row in the heatmap will result in the expression values for that column being overlaid on the network view.
Use shift-drag to draw a box and see results on network.
Use shift-click to pick individual columns.
Select an individual row by clicking on it.
You can adjust the color scheme and contrast by going to Settings. For this demo, select YellowBlue in the colors window. This will change the Red/Green color scheme to Yellow/Blue. Click Close.
Press Map Colors Onto Network and select one of the options from the Attribute List.
Click Create Vizmap. This will map the colors onto the network.
Animate expression values over time
Go to Map colors onto network.
On the pop-up screen, click on specific attributes to select. For this example, select gal4RGexp and gal80Rexp.
Press Animate Vizmap. This will animate the image on the main Cytoscape session screen.
Finding modules and complexes
Now we're going to use clusterMakers 'MCL algorithm to search for modules in the galFiltered network.
Procedure
Start with galFiltered open, as before.
Add a new edge attribute to provide a weight
Cluster with MCL
Visualize clusters
Add a new edge attribute
In the Data Panel click on the Edge Attribute Browser tab.
Now click on the Create New Attribute icon and create a new Integer attribute. Name the attribute Weight.
We're going to set all of our weights to be equal. To do this, select the Attribute Batch Editor icon located at the top right of the Data Panel.
Under operation, select Set and Weight to 1. Then click GO.
Create Clusters
Now that we have weights on our edges, we can use MCL: Select Plugins → Cluster → MCL cluster to bring up the MCL cluster Settings dialog.
If it's not already set: change the Array sources to Weight and click Create Clusters.
After the algorithm has finished, MCL will display a dialog with the summary results.
Visualizing Clusters
To see the clusters in a new network, click on Visualize Clusters.
clusterMaker adds a new attribute (0_MCL_cluster in this case) to the network. Each cluster has a unique number for this attribute that may be used to change the graphics attributes in the VizMapper.