
ヒストグラムをプロットのみならず、
プロットせずにヒストグラムの計算にも使えるらしい。
サンプルデータ
ヒストグラムの描画
プロットせずにヒストグラムだけ求める
参考
プロットせずにヒストグラムの計算にも使えるらしい。
サンプルデータ 
set.seed(0)
df = rbind(
  data.frame(date="2019-12-16", score=rnorm(1000, mean=400, sd=100)),
  data.frame(date="2019-12-17", score=rnorm(1000, mean=500, sd=100)))
ヒストグラムの描画
GNU R - graphics::plot # グラフの重ね合わせ で truehist を使ってやったのと同様のプロットを bin 幅を変えて行うと以下のような感じ。
breaks で bin 幅指定して、right=F とすることで「以上〜未満」にしている。
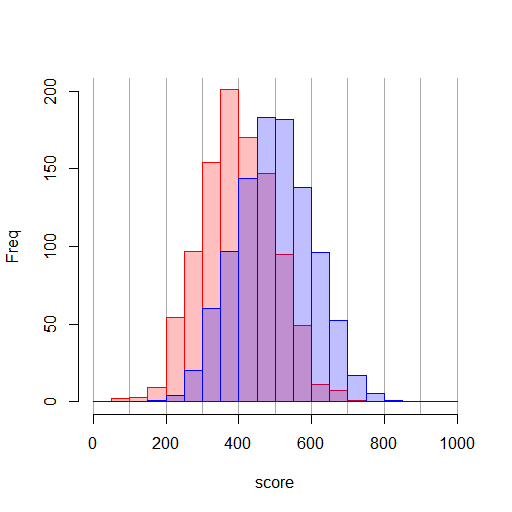
breaks で bin 幅指定して、right=F とすることで「以上〜未満」にしている。
binwidth=50
gridwidth=100
breaks=seq(0,1000,binwidth)
xlim=range(breaks)
ylim=c(0,200)
plot(c(),xlim=xlim,ylim=ylim,axes=F,xlab="score",ylab="Freq")
abline(v=seq(xlim[1],xlim[2],gridwidth), col="#AAAAAA") # グリッドの描画
axis(side=1) # x 軸
axis(side=2) # y 軸
par(new=T)
hist(df[df$date=="2019-12-16","score"],right=F,breaks=breaks,ylim=ylim,main=NULL,axes=F,xlab=NULL,ylab=NULL,col="#FF000040",border="#FF0000")
par(new=T)
hist(df[df$date=="2019-12-17","score"],right=F,breaks=breaks,ylim=ylim,main=NULL,axes=F,xlab=NULL,ylab=NULL,col="#0000FF40",border="#0000FF")
プロットせずにヒストグラムだけ求める
plot=F を与えるとプロットせずにヒストグラムのみ求めてくれるらしい。
group 毎に計算するには、dplyr の group_by()、do() 等を利用する。
group 毎に計算するには、dplyr の group_by()、do() 等を利用する。
binwidth=50
breaks=seq(0,1000,binwidth)
df.hist =
  df %>%
    group_by(date) %>%
    do(.$score %>%
      hist(plot=F, breaks=breaks,right=F) %>%
      (function(x) data.frame(score=x$mids, count=x$counts, percent=x$count/sum(x$count))) %>%
      return)
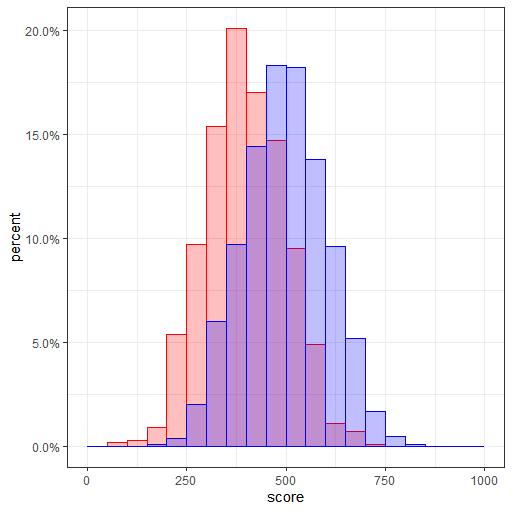
> df.hist
# A tibble: 40 x 4
# Groups:   date [2]
   date       score count percent
   <fct>      <dbl> <int>   <dbl>
 1 2019-12-16    25     0   0
 2 2019-12-16    75     2   0.002
 3 2019-12-16   125     3   0.003
 4 2019-12-16   175     9   0.009
 5 2019-12-16   225    54   0.054
 6 2019-12-16   275    97   0.097
 7 2019-12-16   325   154   0.154
 8 2019-12-16   375   201   0.201
 9 2019-12-16   425   170   0.17
10 2019-12-16   475   147   0.147
# ... with 30 more rows
あとは、これを ggplot2 等に食わせるなどすれば良い。
ggplot(df.hist) +
    aes(x=score, y=percent, fill=date, colour=date) +
    geom_col(position = "identity",width=binwidth) +
    scale_y_continuous(labels=scales::percent) +
    scale_fill_manual(values=c("#FF000040","#0000FF40")) +
    scale_colour_manual(values = c("#ff0000","#0000ff"))+
    theme_bw() %+replace% theme(legend.position="none")
参考
- A plant researcher (村上 貴一) / 2016-03-04: ggplot2を再履修する

タグ
コメントをかく